
I recently got sent a question from an athlete that I’ve advised on and off for a few years, they asked:
“I saw an article the other day from Cameron Brown. In the pic he was doing 35kph but his heart rate was only 125bpm. I realise he is elite, but how do you get so fast with so little effort. Regardless of what discipline I am doing my heart rate is always mid to high 140. Even walking it is 110.”
This is a really good question and I can see where the thought process comes from. It’s a commonly held misconception that your Maximum HR (Heart Rate) is equally 220 minus what ever your age is. I’m currently 41 so in theory my maximum HR should be 179bpm but a few weeks ago I got it up to 187bpm on the bike and 196bpm whilst running. What gives?
Way back when sports science was in it’s infancy, some observant guy noticed that when he got a whole lot of people to exercise maximally the younger people in the group managed to get a higher heart rate than the older people. When they investigated a bit more the 20 year olds averaged about 200 bpm (plus or minus a bit but when averaged out it was 200bpm) when at their maximum and the 40 year olds averaged 180 bpm (once again plus or minus a bit). If I was in this group my 196bpm would have needed to be counteracted by someone who maxed out at 164bpm. But as you can see that it is nice and easy to come up with a simple rule of thumb for the 220 minus your age. Now when looking at a group of people on average it works and works nicely. But when looking at individuals it clearly doesn’t work all the time.
 The other thing that was noted was was that the harder and faster that you went the higher your HR went until you could go no faster. Your maximum HR was when you were exercising at your fastest pace or your highest intensity. Your resting HR occurred when you weren’t exercising at all. The correlation was clear. If you exercised harder than before, your HR went up. If you eased off, your HR went down.
It was also noted that effort was inversely related to the duration you could maintain that intensity. The easier the effort the longer you could maintain it. The harder you went, the shorter the duration you could keep exercising at that intensity. Not exactly rocket science but someone had to quantify it.
Scientists soon discovered that at low to moderate intensities certain physiological responses occurred and at higher intensities different physiological responses occurred as a result of the training stimulus.
Back in the late 1980’s when heart rate monitors moved out of the sports science lab and went on sale in cycling and running stores to help people train, coaches, trainers and advisors needed to explain how to use these new devices. Nearly all the advice in the early days was based around prescribing training zones based on intensity. Lower intensities to develop endurance, higher intensities to develop top end speed.
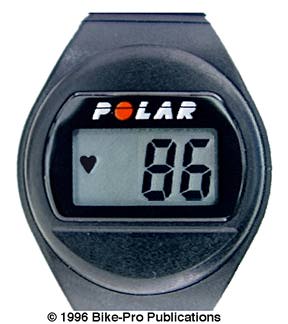 I got my first HR monitor in 1993 when I was in sixth form. It was a Polar Favor and it was pretty flash (so I thought). I worked at the local supermarket to save up for it and it revolutionised my training. It did everything – well everything I thought I needed it to do. It displayed my HR and that was it!! No average HR, no other features just current HR. That flash.
I was 16 or 17 when I got it and I was blown away by the fact my maximum HR should have been 203 or 204 but I would regularly get my HR up to 206 when riding up a local hill called Kaiti Hill. I would suffer to get it that high but I could get it that high. I was disappointed that I had spent all this money on such a flash HR and it was obviously wrong as in theory I couldn’t exercise at 102% of my maximum. Surely my heart was exploding.
At a race I ended up talking to a cardiologist in a casual conversation and took the opportunity to discuss my new training tool, as HR monitors were rapidly gaining popularity in the early 90’s. I explained that it must have been faulty and my theory as to why it was out by a few bpm. He explained to me that 220 minus your age was a rule of thumb that was only accurate for 20% of people the other 80% of us could be up to 25bpm either above or below the theoretical maximum HR. This was one of my first introductions to how to apply theory in the real world.
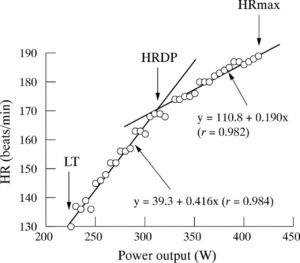
 Soon after this I met an actual sports scientist who was in my home town conducting a seminar I attended. I can’t remember his name or exactly what he was presenting but as a high school student with an interest in racing faster my mind was blown with the application of this new technology. He discussed the deflection point of a Conconi test that I had read so much about in Peter Janssen’s book Training Lactate Pulse-Rate. I’d tried to replicate this test at the local athletics track using my Polar Favor and this sports scientist said it was a waste of time. What?
This test was the gold standard. It was discussed in the only book on the subject I knew and in all the magazine articles on the subject and this GUY reckoned it was a waste of time!!!! He did have a point, it was hard to do. Hard to get the pace/speed right. Hard to be consistent.
But what did he suggest instead? A 5km running time trial or for cyclists a 20km time trial. Do that as hard as you can and record your average HR. Your average HR would be pretty much equal to the deflection point from the Conconi Test, give or take a couple of bpm but close enough to be applicable in the real world.
But what is more, he recommended that your training zones be based on this and not on your maximum HR. To enhance your ability to run or ride at threshold pace you need to run or ride at between 98 & 106% of your Threshold HR. Gee that makes sense to me totally, I didn’t need to be a rocket scientist to understand how that works but that was a light bulb moment.
He also suggested that instead of working at a low percentage of your maximum HR to improve your endurance you should work at a moderate percentage of your maximal steady state HR (i.e. what you held as an average HR for the Time Trial).
I think it was the very next day I went and did a 20km TT whilst wearing my Polar Favor with a pen in my pocket and every few minutes when my alarm went off on my wrist watch (that was on my opposite wrist from the Polar) I would look at the Polar and grab the pen writing my HR number on my arm. At the end of the workout I worked out my average HR from all the numbers written on my arm. The day after that I upgraded and had a pen AND paper in my pocket when I did my 5km TT. This was so much easier than trying to do a Conconi test.
I had also learnt about Karvonen’s formula from the book and articles that I had read. Some people would calculate the training intensities based purely on Maximum HR. Now a car doesn’t idle at zero revs and neither do you. A car that has it’s revs at zero is turned off, but a human whose HR is zero is dead. When you are resting, your HR is at it’s lowest and is known as your Resting HR. Karvonen’s formula takes this into account and determines training zones as a percentage between your resting HR and max HR (you can also use it in principle using resting HR and threshold HR instead of max HR). You simply calculate the HR reserve which is the difference between resting and max HR (or threshold HR if that is what you are using) and then workout the percentage of that range, then re-add the resting HR to it.
Target HR = ((Max HR – Resting HR) x % Intensity) + Resting HR
Why is this important? Consider two people about the same size: Person A who is reasonably fit and well conditioned athlete, about 30 years old and person B who is pretty unfit, overweight and also about 30 years old. For arguments sake they both have a max HR close to 190Bpm. Person B has a typical resting HR. Depending on what you read and where you read it you might be told 60 Bpm is a typical Resting HR or maybe you read 72Bpm which are both typical numbers to be published in a physiology text book. Lets go with 60bpm for Person B, just for arguments sake. Person A being fitter can pump more blood with each beat of their heart so when resting they don’t require as many beats to deliver the oxygen around their body that they need. Their resting HR might be 40bpm. Mine is typically 38-42bpm depending on the quality of my sleep. Person A has a HR reserve of 150bpm (190-40) and person B has a HR reserve of 130bpm (190-60).
Seems pretty clear cut. We’ve got our HR reserve so we can plug in the percentages and get our HR zones straight from that can’t we? Not so fast. Remember what the sports scientist suggested using the maximum steady state or threshold HR as the ‘set point‘ instead of the maximum HR. But why would you?
Lets look at Person A. They are fitter than Person B who is a unfit and a bit overweight. Lets assume they are both 10k runners. Based on the information we have we can assume that Person A is going to be faster for arguments sake. Lets say they are a 40 minute 10km runner and Person B is a 50 minute 10km runner. Other than the obvious pace difference, they will also have a difference in the HR they can maintain for their pace. We can surmise that Person B is working at a lower relative intensity because they are working for longer to cover the 10km.
It is likely that as Person A is fitter they can also maintain a higher percentage of their HR reserve for longer. But genetics might play a factor in this and allow Person B to suffer more and actually hold a higher HR. But, if I was a betting man, I would be betting on Person A holding a higher HR.
Lets say that Person A averages 176bpm for their 40min 10km and Person B averages 168bpm for their 50min 10km. That is operating at 91% and 83% of their HR Reserve respectively. We can see that Person A is working hard, but Person B is working for longer so it’s not a true comparison of apples to apples.
It might seem that a 10km run a fair comparison but it isn’t comparing apples with apples as person A suffered for a full 10min less. If we sent them both for a 60min run and told them to see how far they can cover in that 60min, I’m sure Person A will be around 14.5km (based of their 10km pace) and Person B will be a bit short of 12km (also based on how qwikly they covered 10km). Regardless of how far they actually cover it will be a tough run for them both and they will have worked pretty hard for a full 60 minutes. They won’t be able to maintain the HR as high as they did in the shorter 10km workout. I’d expect it to be a few bpm below what they maintained for the 10km, possibly around the 170-172 mark for Person A and maybe 163-165 mark for Person B. Whatever it is, it won’t be as high. The key thing is that they are different based on their individual and genetic make up.
Although they are both similar in size, age and max HR they get a different result. But what about athletes that are all pretty similar in ability. Here is where is gets a bit tricky.
A good example of a whole lot of athletes performing similarly can be found on the bike leg (particularly early on the bike leg) at Hawaii Ironman. A reasonable number of top pro’s will all be riding about the same speed in what can best be described as a loose group (although not necessarily or technically drafting- I’m not going to get into a discussion about drafting here). Some of the stronger cyclists will be taking it relatively easy here saving themselves for later in the race when the going gets tough. Some of the other pro’s will be riding out of their skins and seemingly having the performance of their life but later on in the day they won’t be there. They are all racing but some are racing harder than others. Some will be bigger and stronger and needing to put out more Watts to stay in the group, others will be smaller and not needing to put out so many Watts, but relative to their body weight or to their FTP might be riding hard or near their personal limit. Some of them will be taxed aerobically and riding with a high HR and others not so much and at a lower HR. But what is their maximum stead state HR whilst riding? How close to this are they? Can they continue at that effort? Draw the comparison with Person A and Person B above.
As you can see we are all individuals and all respond differently to the exercise demands we put our bodies under. The more time you have to develop an efficient aerobic engine, the more efficient it will be. The better your lungs will be at absorbing the oxygen from the air and transferring it into the blood. The better the heart is at pumping the blood to the muscles that are working and the more effective those working muscles are at absorbing the oxygen from the blood to deliver it to the mitochondria of the muscle cells to enable them to utilise energy for the contraction.
Cameron Brown has been a top level professional triathlete for nearly 30 years. He has an exceptionally efficient aerobic engine. He has also been gifted great genetics by his parent and when those factors combine he can deliver an exceptional performance that hasn’t diminished much as he has got older. I’ve got no idea what his max HR is or what level he can hold at a maximal steady state.
For arguments sake if his social media post said Cameron Brown was operating at 75% of what he can maintain as a maximal steady state, his 75% might be 125bpm and 35km/hr (we also don’t know the terrain or wind direction it could have been slight downhill and/or tailwind). My typical 75% is about 150bpm and about 27km/hr on the flat with no major wind. Yours will no doubt be different.
The important take away is that we are all different. If we could absorb the training load that Cameron can, and if we had his genetics and the time available to do so (both the training time per week, and the 30 years to build it), we could also develop the level of efficiency that he has accumulated over 30 years.
Take the time to build your base effectively and then add your speed work on top of it and you can be the best that your genetics will allow.