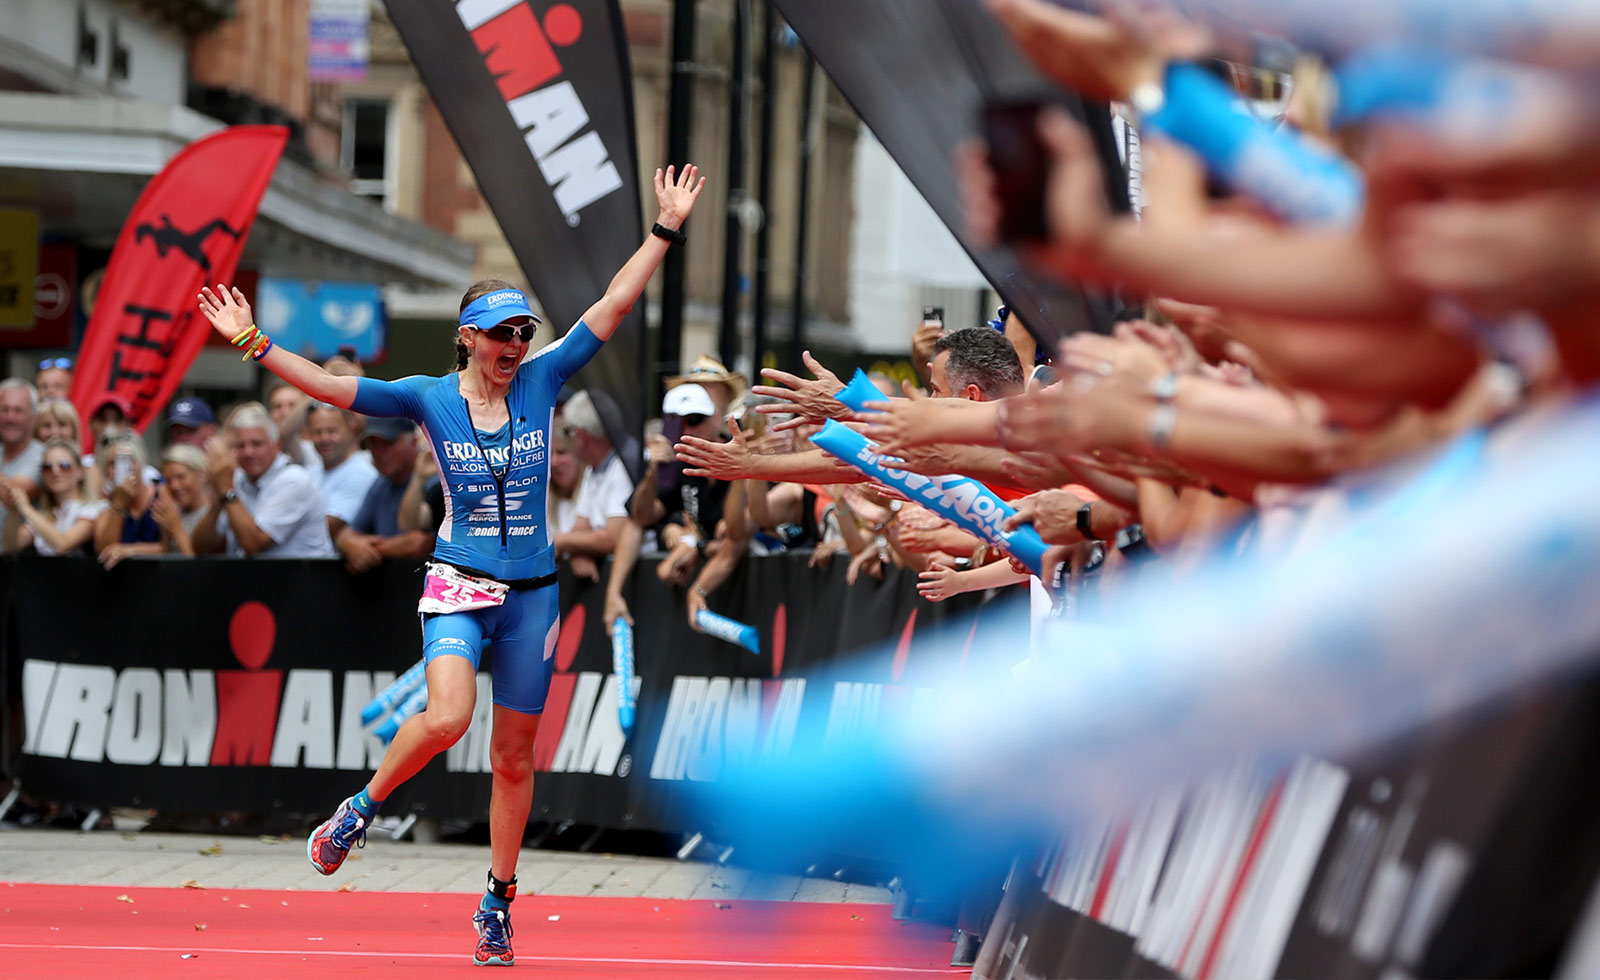
When an athlete hasn’t done an Ironman event previously what time do you think they can do? Tough question because they have never done the event before (often they haven’t done something similar) and are stepping into the great unknown. Rüst et al has attempted to answer this for female athletes (who make the bulk of Qwik Kiwi athletes).
Rüst, CA; Knechtle, B; Wirth, A; Knechtle P; Ellenrieder, B; Rosemann, T; Lepers, R; (2012) Personal Best Times in an Olympic Distance Triathlon and a Marathon Predict an Ironman Race Time for Recreational Female Triathletes Chinese Journal of Physiology 55(3): 156-162
Ironman events continue to gain in popularity with a 3.8km (2.4 mile) swim, 180km (112 mile) cycle and a 42.2km (26 mile) run. Tens of thousands of athletes compete in Ironman events world wide each year. Pre-COVID an event was held most weekends somewhere in the world.
A number of researchers have looked at what can be used to predict times for recreational athletes, but very few have a reasonable sample size of female athletes. The researchers have endeavoured to fill this void.
They analysed training data, previous race performances at the Olympic distance and marathon, as well as anthropometric data of 59 non-professional, first time, female athletes at the Ironman Switzerland event over four years. Of those 59 athletes, 53 completed the event.
Characteristics of the participants showed them to have an:
- Average age: 37.0 years ± 6.7
- Average height: 1.67 metres ± 0.06
- Average weight: 59.9 kg ± 5.9
- Average BMI: 21.3 ± 1.6
- Average body fat: 23.8% ± 5.7
- Average weekly training hours: 14.1 hours ± 3.5
- Average weekly swimming distance: 6.2 km ± 2.7
- Average weekly swimming duration: 2.8 hours ± 1.1
- Average weekly cycling distance*: 196.6 km ± 83.5
- Average weekly cycling duration*: 7.4 hours ± 2.5
- Average weekly running distance: 41.0 km ± 10.7
- Average weekly running duration: 4.1 hours ± 1.0
- Average Personal Best (PB) Olympic distance Triathlon*: 2hr 32min 30sec ± 15min 18sec
- Average Personal Best (PB) Marathon*: 3hr 50min 42sec ± 26min 6sec
* statistically significant correlation
On analysis of the data showed that only four variables were significantly associated with the overall finishing result: duration of cycle training time each week; distance of cycle training each week (they both go hand in – the further you ride the longer it takes); Olympic distance race PB and marathon PB.
Thinking about this it all makes sense. Ironman is all about having the engine, the heart and lungs that can process oxygen to fuel continuous aerobic exercise. The more you develop this the better your performance will be on the day of the event – this is arguably enhanced by increasing your cycle training volume (too much running volume will create overuse injuries as well as burnout).
Further to this previous performance in triathlon will compare to future performance in triathlon, so finding a correlation between Olympic distance PB to performance in an Ironman is not surprising either.
Finally, the better the runner you are, the more likely you will run well at Ironman. Conversely, the worse you normally run, the more likely you will be forced to walk at Ironman, negatively affecting your performance out of proportion. Therefore, meaning that the better runners are going to perform better at Ironman regardless of the relative poorness of their swim and bike performance.
The researchers developed a formula that will predict an approximate race time:
Race time = 186.3 + (1.595 x Olympic Dist PB) + (1.318 x Marathon PB)
all times are in minutes
The researchers continued by making comment about the significant impact that nutritional interventions during the event can significantly affect race performance and this should be factored in for future research. Affectively implying that there are limits to how reliable their calculation is. But the key point remains this is a good starting point for an estimation of performance for a first time, recreational, female athlete.
For more Science on Sunday articles here is last weeks article:
